27 Interesting Marketing Charts Every Client Needs to See
May 24, 2016 // 9:00 AM (Original post date)
Written by Jami Oetting | @jamioetting
.jpg?width=640&name=Adobe%20Spark%20(27).jpg)
 What's the #1 thing clients value in their agency partners?
 It's not results, strategy, or even great creative.
According to the Society of Digital Agencies, it's expertise in emerging trends.
Now think about the last time you delivered this type of information to your client. If it's been a while, then you've got some work to do.
Clients want this information, and if you are able to provide advice and direction on how they should be investing in not only growing their business today but what they need to do to prepare their company to compete one, two, or five years from now, your agency will be in a better position to retain the relationship or even benefit from upselling opportunities.
To do that, you need to be searching for what's next and selling them on testing and trying out new channels, distribution models, and ways of connecting with customers. To get you caught up on what your agency and your clients should be paying attention to in the world of marketing and buying behavior, check out these interesting charts.
27 Charts That Point to the Future of Marketing and Buying
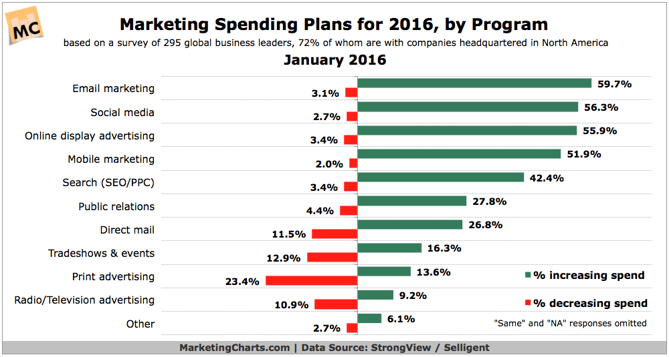
1) In 2016, companies increased budgets for email marketing, social media, and display advertising.
Source: Marketing Charts
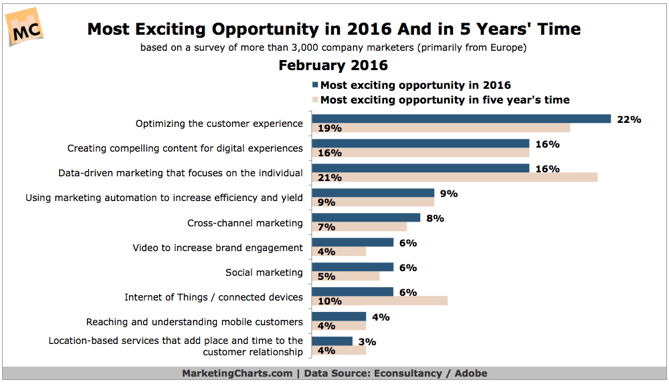
2) Marketers are most excited about opportunities in optimizing the customer experience, creating compelling digital content, and using data to connect on an individual level with consumers.
Source: Marketing Charts
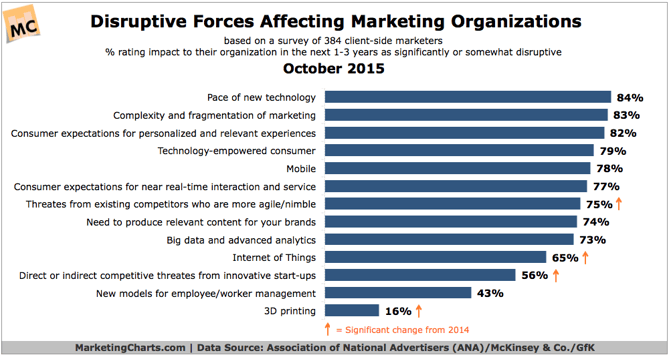
3) The pace of technology, the increasing complexity of marketing, and the tech-empowered consumer are seen as disruptive to companies.
Source: Marketing Charts
4) Time spent on mobile grew 31% in 2015, while desktop continues to fall.
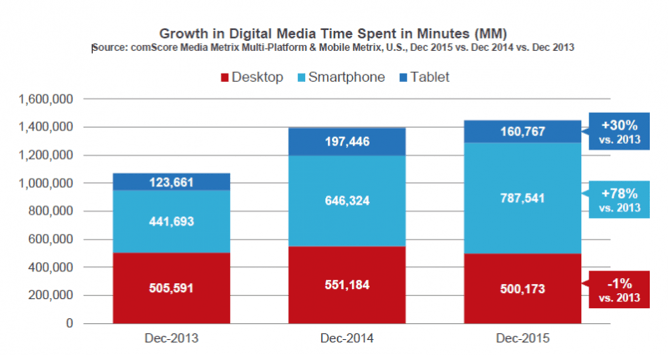
Source: comScore
5) 70% of digital ad spend will go to mobile by 2019.
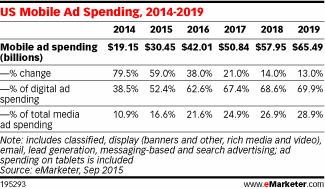
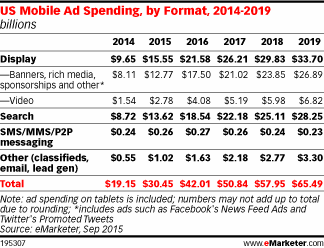
Source: eMarketer
6) Mobile-friendly websites rank higher in search engine results.
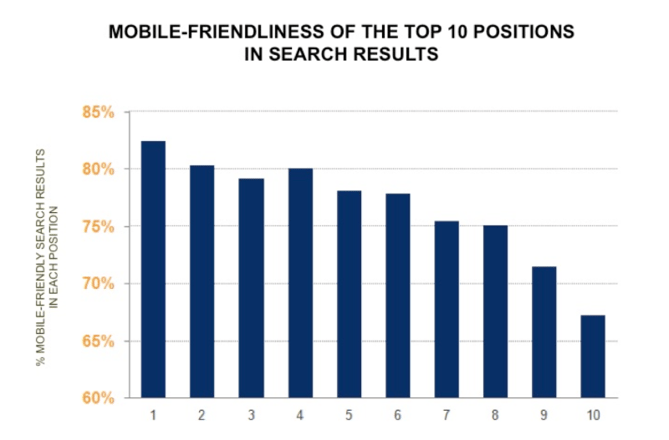
Source: Moovweb
7) 90% of time spent on mobile is in apps.
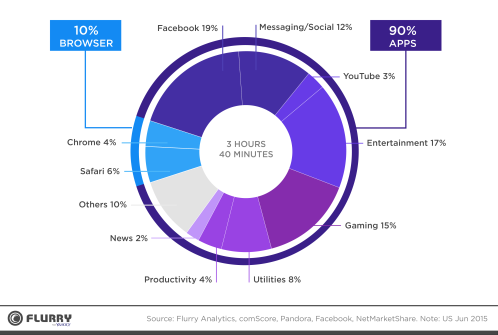
Source: Flurry
8) Facebook owns the top four of the most used apps globally. 6 of the top 10 apps are messaging apps.
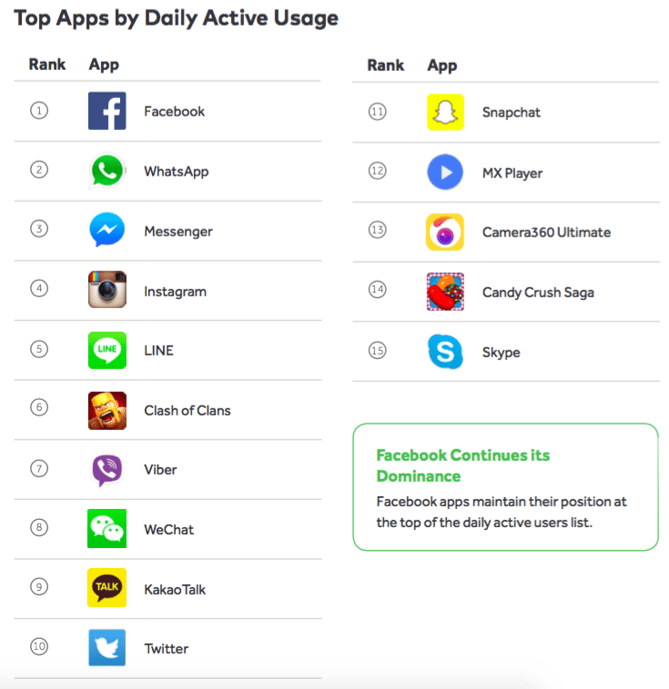
Source: Mobile App Landscape: 2015 Q3 Report
9) 29% of view time is spent viewing using a vertical screen.
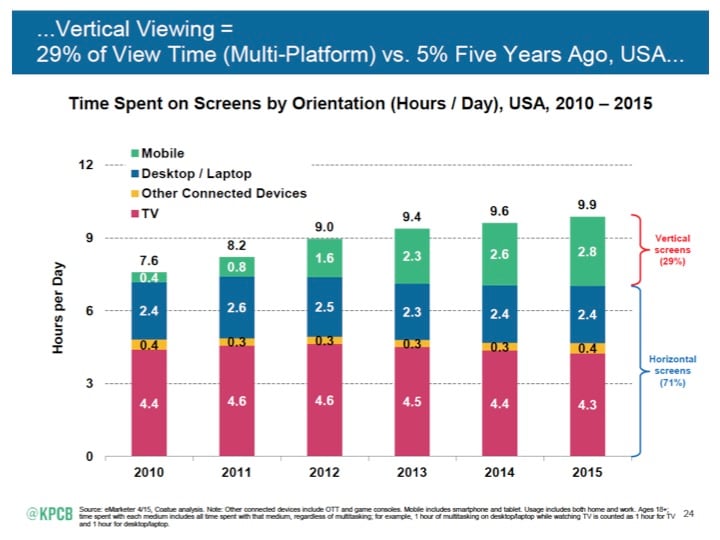
Source: KPCB
10) Native Facebook video posts get more reach than any other content format.
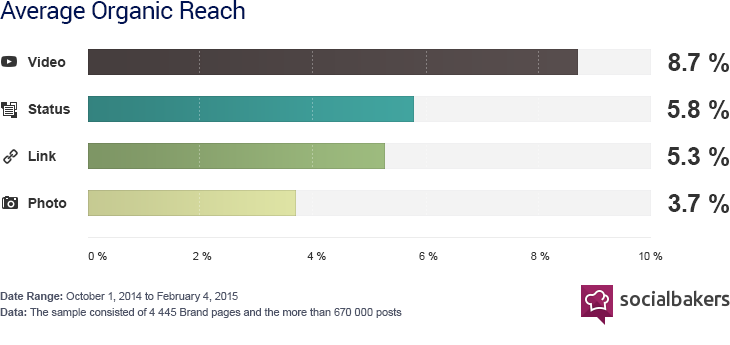
Source: Social Bakers
11) Users spend nearly two hours watching digital video, more than time spent on social networks.
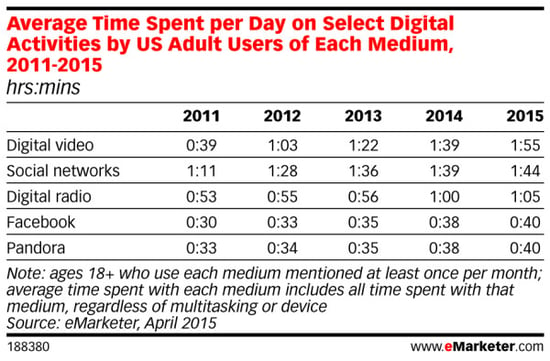
Source: eMarketer
12) Video content engagement grew 255% in one year.
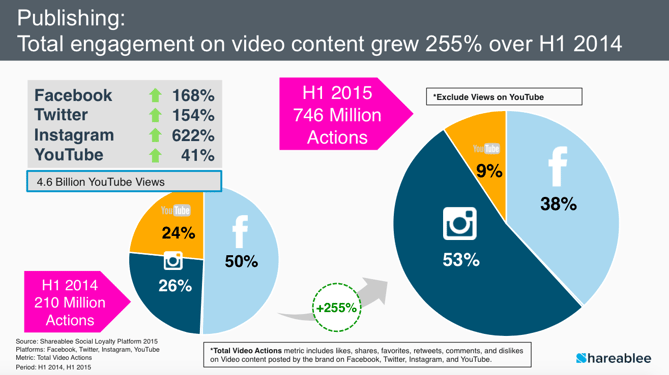
Source: Shareablee
13) 60% of people surveyed have started using voice search commands within the past year. Recently, Google said that 20% of queries on Android devices and its mobile apps are voice searches.
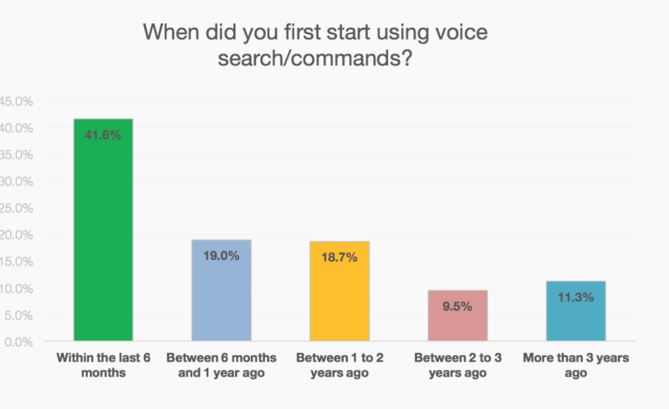
Source: MindMeld
14) Snapchat users watch 10 billion videos per day, up from 2 billion a year ago.
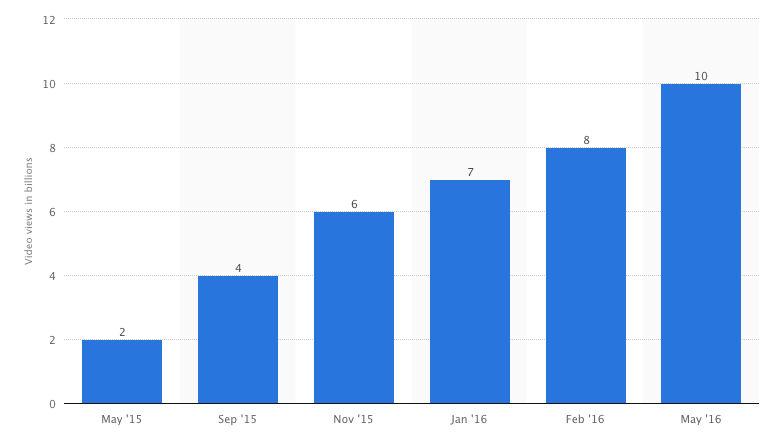
Source: Statista
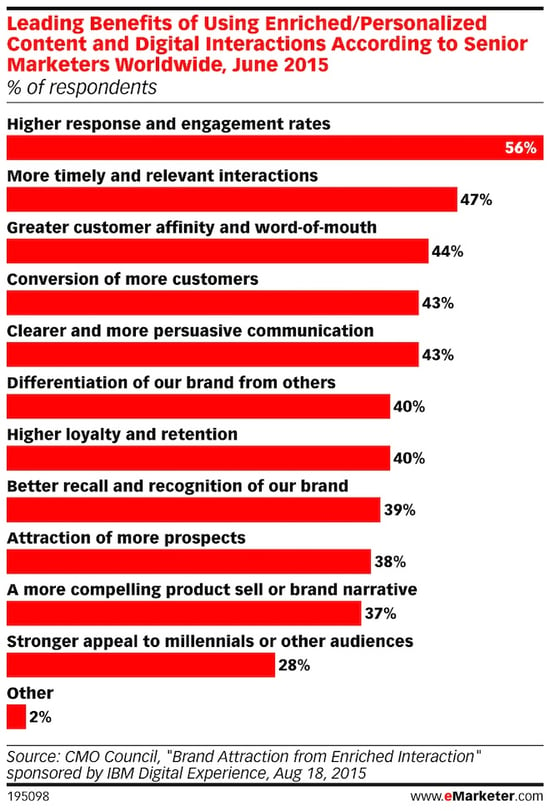
15) Personalization leads to higher engagement and more relevant interactions, according to marketers.
Source: eMarketer
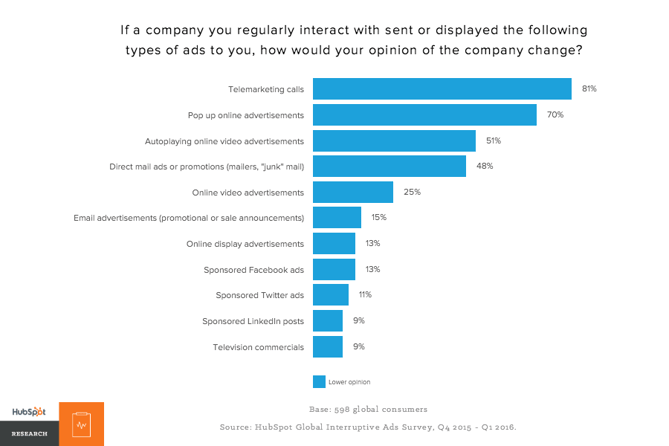
16) People hate ads, and their opinion of a brand can change based on the ads it buys.
Source: HubSpot Research
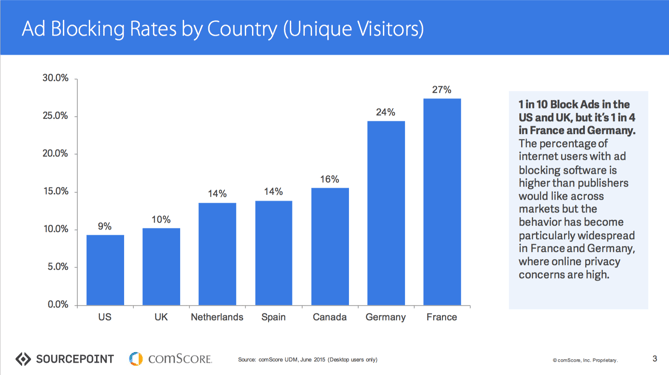
17) Ad blocking adoption rates are higher outside of the U.S. There are now 198 million adblock users worldwide.
Source: Business Insider
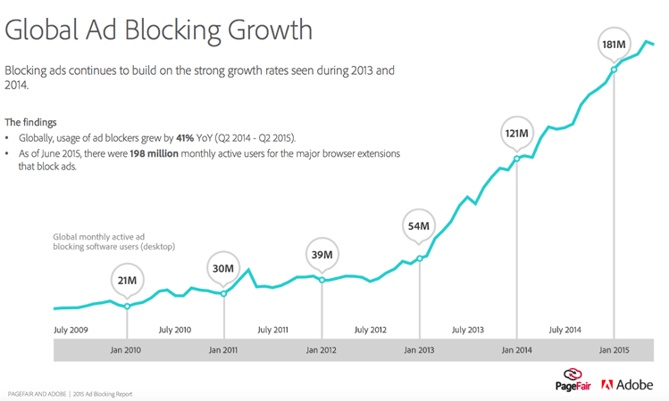
18) Adblock usage grew 41% in 2015, and adoption rates are speeding up.
Source: PageFair
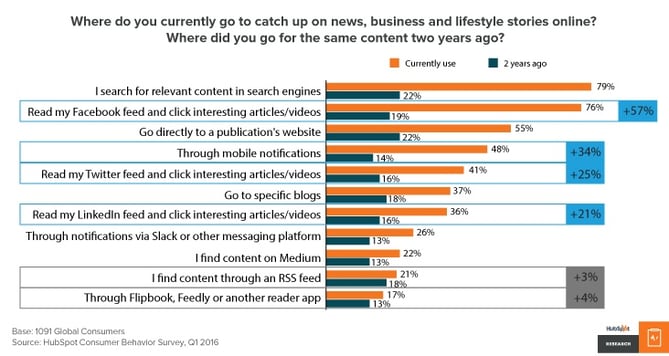
19) News sources are changing.
Source: HubSpot Research
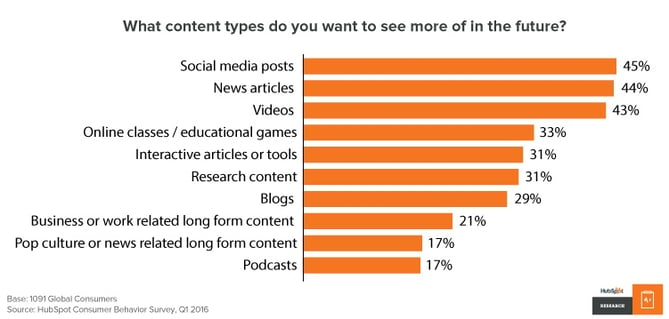
20) People want different types of content, including more videos, online classes, research, and interactive tools.
Source: HubSpot Research
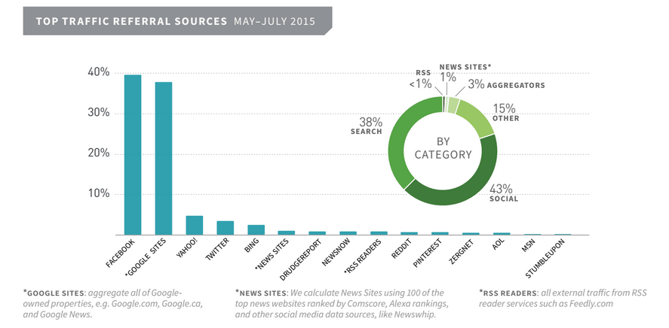
21) Facebook sends more referral traffic to publishers than Google.
Source: Business Insider
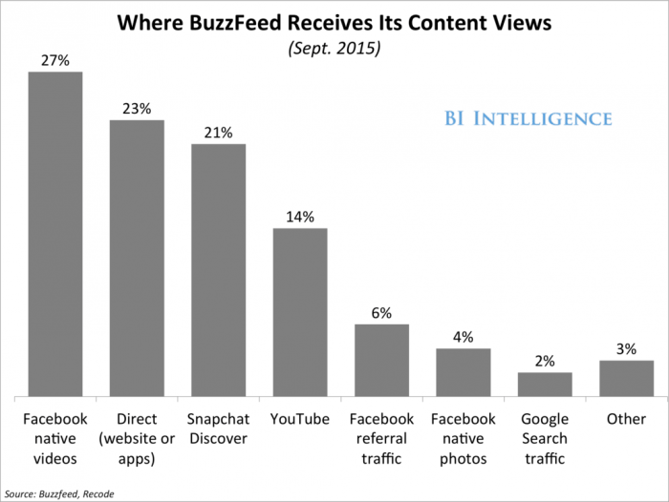
22) Buzzfeed content sees 7 billion monthly views of its content, up from 2.5 billion per month last year. 75% of those content views occur outside of its website.
Source: Business Insider
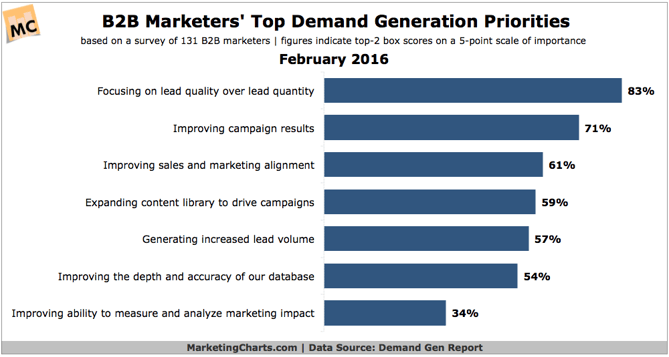
23) B2B marketers' top pain points around lead generation are about lead quality, improving results, and sales and marketing alignment.
Source: Marketing Charts
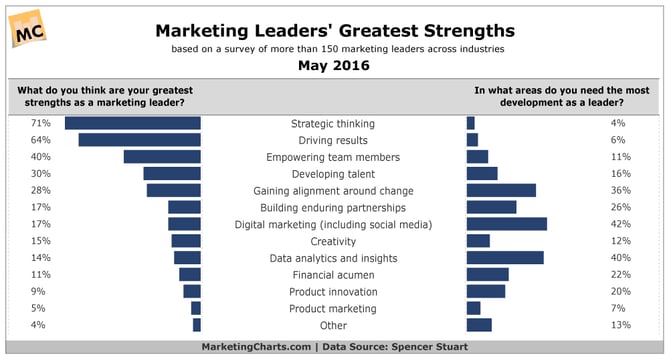
24) Marketing leaders need the most help with digital marketing, data, and change management.
Source: Marketing Charts
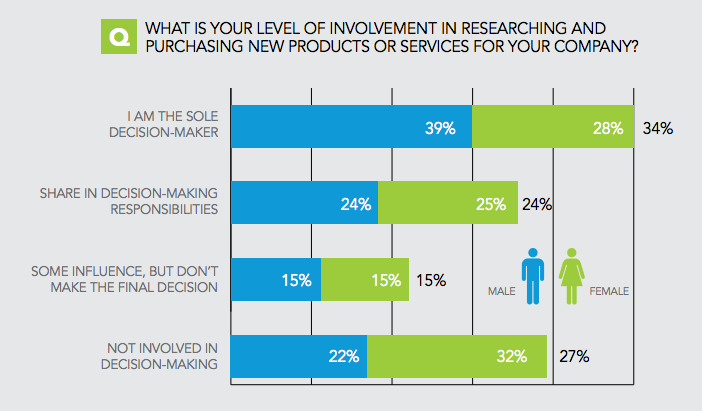
25) 73% of millennials are involved in purchase decision-making at their companies.
Source: Sacunas
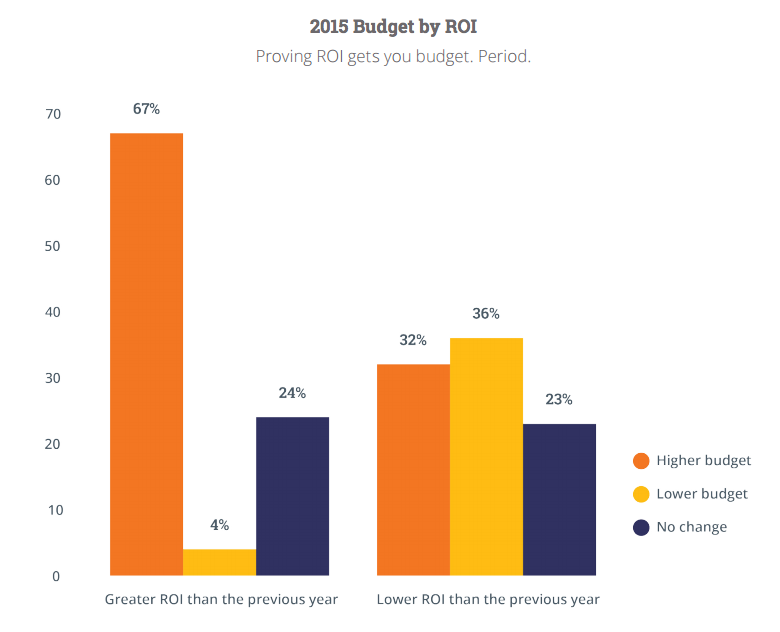
26) Proving ROI leads to larger marketing budgets.
Source: State of Inbound
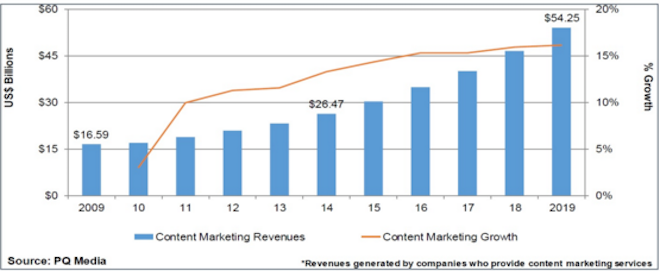
27) Content marketing revenues are expected to reach $54 billion by 2019.
Source: Marketing Mag


